High employment in the Nordics as workforce ages

The populations in the Nordics are ageing, which means that the working age population must support a growing number of elderly individuals. This is partly mitigated by the fact that the employment rates have been increasing among 65-69-year-olds. From an EU perspective, the employment rates in the Nordics are high. When it comes to the unemployment rates however, two Nordic countries stand out with high levels of unemployment.
On World Statistics Day 2024, a new landing page for labour market was announced at Nordic Statistics. The page was updated from 3 to 26 graphs, divided into five sections. One year later, we are happy to announce that the landing page for labour market has been updated once again. This time with the possibility of using a so-called filter function for most graphs on the page. The filter function allows the user to change various background variables, such as gender and age, directly in the interface.
In this article, we will cover aspects of the Nordic labour market that is related to demography, employment and unemployment. For more information about the Nordic labour market, for example NEET rates, activity limitations, work related accidents or absences from work, please visit the landing page for labour market here.
Demography
The size of the working age population sets the framework for any welfare system. More importantly is the size of the working age population in relation to those that cannot support themselves financially. This relationship can be examined by making use of so-called dependency ratios. The demographic dependency ratio is a measurement that highlights the relative size of the working age population in relation to those who are either too young or too old to participate in the labour market. The dependency ratio can also be viewed for both groups simultaneously.
In the figure below, the old age dependency ratio is displayed. It reflects how many individuals aged 65 years or older that theoretically needs to be supported by the working age population, expressed as a percentage. A value of 50% implies that every person in working age needs to support 0.5 additional elderly persons besides themselves. The measurement is theoretical since there may be individuals in working age that are unable to participate in the labour market. There are also individuals above 65 years of age that do participate in the labour market.
The full lines up until January 1, 2025, displays historical dependency ratios. Whereas dotted lines from 2026 displays projected values based on the population forecasts made by the National statistical institutes.
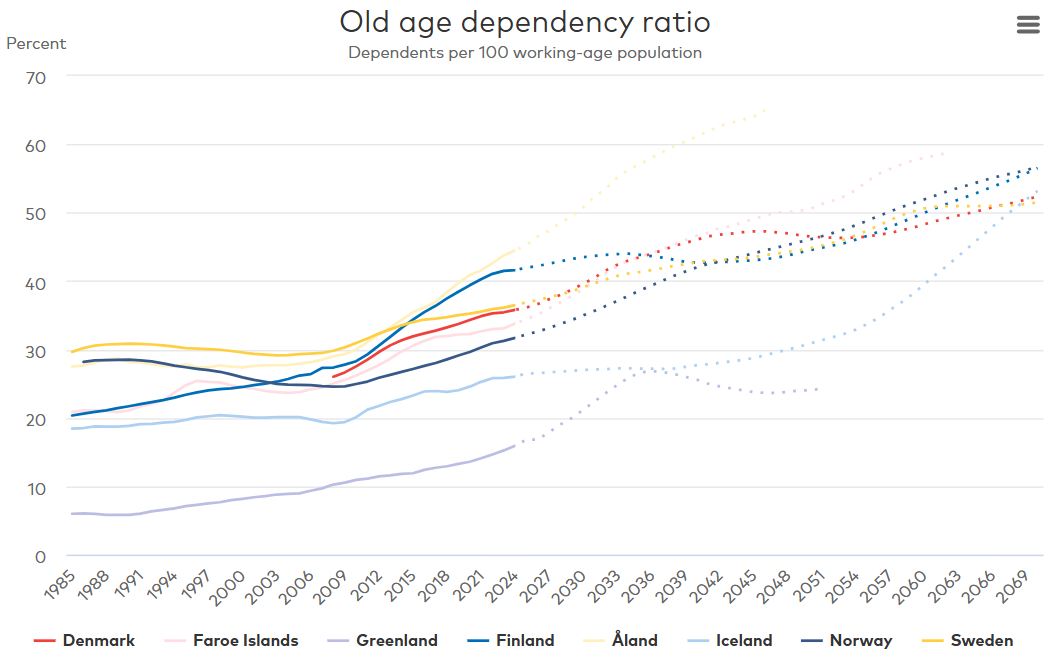
Source: Nordic Statistics Database, POPU11
The old age dependency ratio has increased for all Nordic countries since 1985, which implies that the elderly population has grown faster than the working population in all countries. The ratio has been increasing at a higher rate since about 2010, when the large generation born in the 1940s started to reach an age over 65 years. The highest dependency ratios in 2025 can be seen for Åland and Finland. Whereas the lowest dependency ratios can be observed in Greenland and Iceland.
As for the forecasted dependency ratios, they are expected to increase in all Nordic countries in the following years. Partly because the relatively large generation born in the 1960s will soon start to reach an age over 65 years. Interestingly, the expected development is quite different for Finland and Åland that have similar dependency ratios today. In 2045, Åland is expected to have the highest ratio at 65%, followed by the Faroe Islands at 49% and Denmark at 47%.
Employment
When the number of employed individuals is divided by the number of individuals in the total population, the employment rate is retrieved. The calculation must be made for individuals that belong to the same age group, to retrieve the employment rate for that specific group. Usually, the age group 20-64 years is used, but any age group can be used. It can also be calculated, for example, only for women or for any subpopulation.
In the figure below, the employment rate is presented for the age group 20-64 years for both genders.
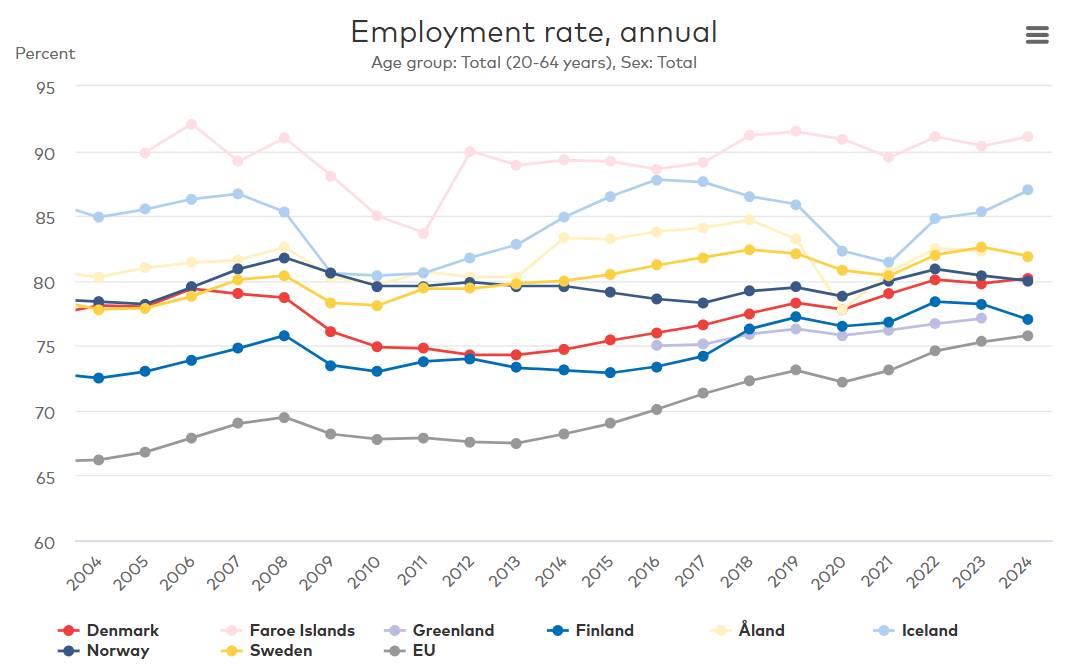
Source: Nordic Statistics Database, WORK02
All Nordic countries have reported a higher employment rate compared to the EU average for the past 20 years. Although in recent years, the EU average has approached the employment rate levels of Finland. On the contrary, the employment rate in the Faroe Islands and Iceland has been consistently high. Especially in the Faroe Islands, which have consistently recorded employment rates around 90 percent during the past 10 years.
Not surprisingly, all Nordic countries and the EU experienced lower employment rates during the financial crisis in 2009 and the pandemic years 2020 and 2021. In 2024, the employment rate decreased slightly in Sweden, Norway and Finland compared to 2023. In contrast, the employment rate increased in the Faroe Islands, Iceland, Denmark and the EU.
As earlier mentioned, the employment rate can also be calculated for other age groups, as in the figure below, where the employment rate among those aged 65-69 years is displayed.
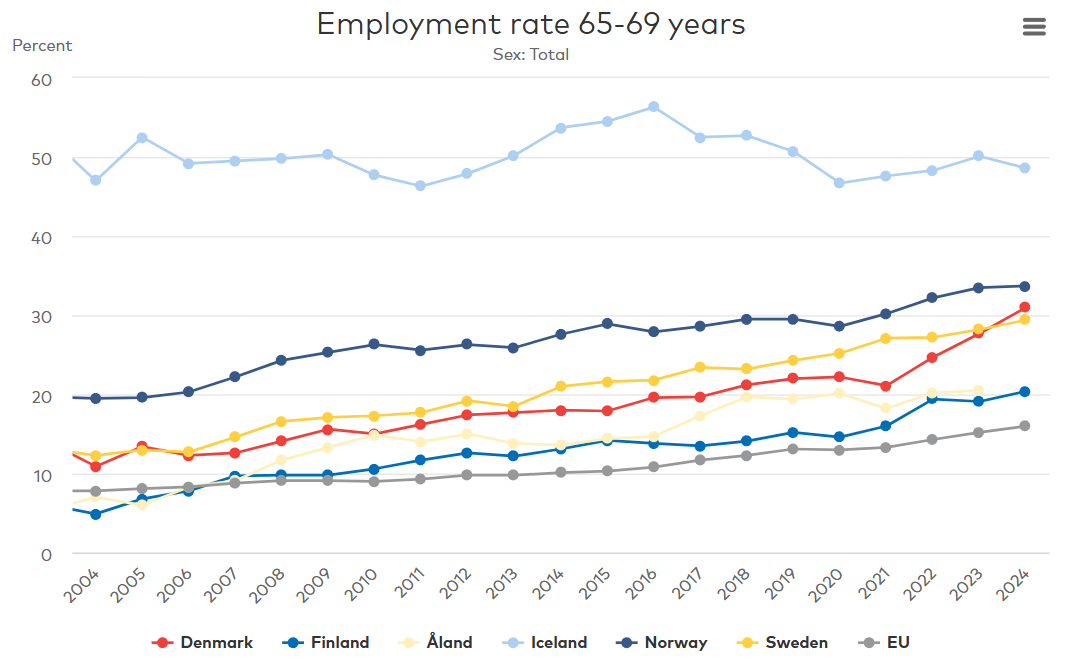
Source: Nordic Statistics Database, WORK02
It is evident that the employment rate in Iceland stands out in the age group 65-69 years. This employment rate has remained stable around 50 percent during the past 20 years. For comparison, the employment rate was 16% in the EU in 2024. However, this is quite a large increase from 7.8% in the EU in 2004. The share of employed individuals in this age group has consequently doubled in the European Union during the past 20 years.
A similar pattern can be seen in the other Nordic countries as well, where all countries report substantially higher employment rates in 2024 compared to those 20 years ago. This ties back to the old age dependency ratios. When the populations in the Nordic countries are ageing and we are also live longer lives (see previous article on life expectancy), there is a need for higher retirement thresholds to finance the care for the young and elderly.
Unemployment
The number of unemployed individuals in an age group divided by the number in the labour force in the same age group gives the unemployment rate. Any age group can be used, just as for the employment rate.
It might be intuitive to think that the unemployment rate would behave as a mirror reflection of the employment rate. However, the unemployment rate is calculated by dividing unemployed individuals with the labour force instead of the entire population in that age group. Subsequently, this is not the case. Individuals outside the labour force (which are not considered when calculating unemployment rates) are sometimes referred to as the “inactive population”. This refers to individuals that does not work and are not looking for work. For example, those who are retired, students, stay-at-home parents, or are unable to work due to illness or disability.
In the following figure, unemployment rates are displayed for the age group 20-64 years.
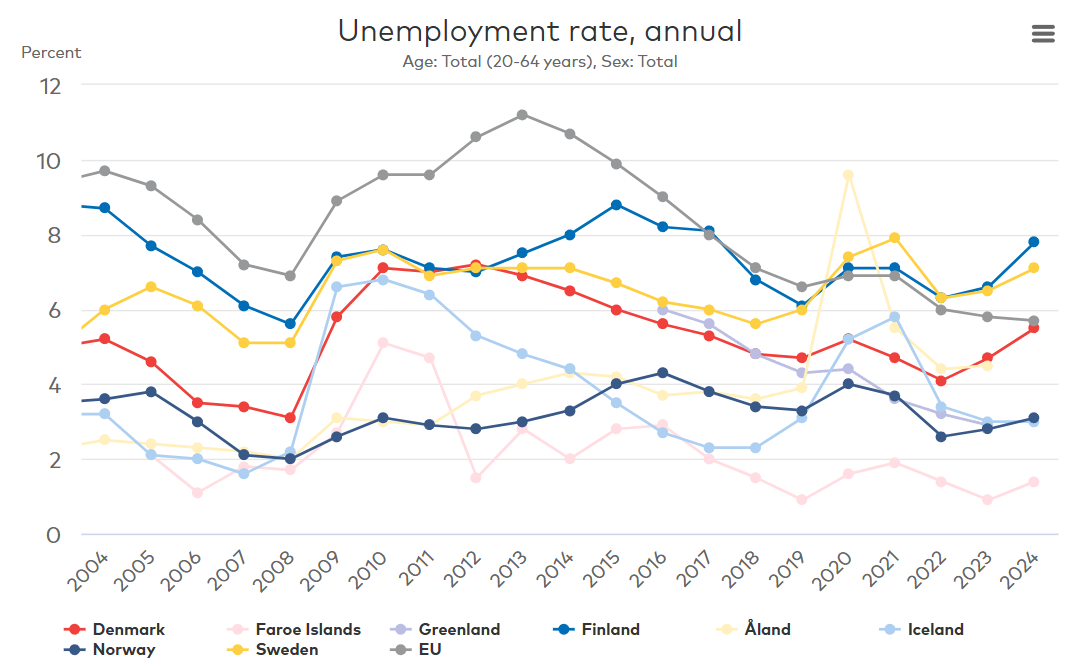
Source: Nordic Statistics Database, WORK02
The unemployment rate increased in all countries between 2008 and 2009 as a result of the financial crisis. However, the effect varied greatly between countries. For example, Norway witnessed an increase from 2.0% to 2.6%, whereas the unemployment rate tripled in Iceland from 2.2% to 6.6%. This is likely a consequence of the severe effects that the banking crisis had on the Icelandic economy.
During the pandemic, the unemployment rate also increased in all the Nordic countries. Especially in Åland, although the unemployment quickly dropped in the following years [1].
The EU average unemployment rate has remained high since 2004. Since the pandemic however, both Sweden and Finland have reported higher levels of unemployment than the EU average. Finland reported the highest unemployment rate in 2024 at 7.8%, followed by Sweden at 7.1%. For the past two years, the unemployment rate has increased in Sweden, Finland, Denmark and Norway. In the same time period, the unemployment rate has continued to decrease in the EU.
[1] Unemployment rates for Åland are based on register data by the main activity status of the population at the end of each reference year.